Here we show that one such secret is the use of a ``consensus'' approach in fold recognition. By using several different methods, the same method with different parameters or searching using several homologous sequences a ``consensus'' prediction can be made. The consensus analysis can also be done using only a single sequence and a single method, by searching for similar hits among the top-scoring hits. In contrast, most automatic methods do only use a single sequence, a single set of parameters and do not use the top-scoring hits to search for ``consensus'' predictions.
Here, we will describe a new method for fold recognition, Pcons, that utilizes the ``consensus analysis'' to improve automatic fold recognition. We will describe the process behind the development of Pcons. Starting with the use of a ``semi-automatic'' method in CASP4, and the later development of the fully automated Pcons method. We will show some results from large scale benchmarking that shows the advantages of Pcons. Finally we will describe some recent development that has improved the performance of Pcons further.
As the genome projects proceed, we are presented with an exponentially increasing number of protein sequences, but with only a very limited knowledge of their structure or function. Since the experimental determination the structure or the function is a nontrivial task, the quickest way to gain some understanding of these proteins and their genes is by relating them to proteins or genes with known properties.
From other examples in this book it is clear that there are many different fold recognition methods. Different methods are based on single sequences [36,25], multiple sequence alignments or profiles [13,2,17,32], and predicted [11,31,30,18] or experimentally determined [16] structures. It is not clear which features are most important and how they should best be combined. However, what is noticed is that it seems to be of great importance with detailed choices of parameters to get the best performance.
Several different methods to benchmark the performance of these methods has been developed, including large scale benchmarks[1,28,27,20], blind-predictions [23,10,12] and automatic benchmarking of all newly solved protein structures [4,5]. Several groups have also benchmarked the alignment quality for different fold recognition methods [7,4,33,8].
The large scale benchmarked were based on databases of structurally related proteins, such as SCOP [24] and CATH [26]. In these benchmarks it was concluded that the use of fraction identity as a measure of similarity between two proteins should be abandoned [1]. It is much better to use statistical measures, such as E- and P-values used in BLAST [2] and FASTA [29]. In these studies the performance of several different methods was compared and methods that use multiple sequence information perform better than methods using only single sequence information [27,8]. Different studies gave slightly different results on how to utilize the multiple sequence information best. However, it was clear that PSI-BLAST [2] performed very well and was one of the computational most efficient ways to use multiple sequence information.
It was also observed that different methods perform best at different levels of relationship [8]. For proteins that only share the same fold, i.e. does not have a common ancestor, it is better to use methods that completely ignore the sequence, while for protein that are more closely related it is better to utilize the sequence information.
In later studies other fold recognition methods were also included in large-scale benchmarks. Here it was observed that several fold recognition methods perform better than PSI-BLAST, when detecting distantly related proteins [8,4,5]. Several, but not all, of these methods use structural information. The structural information can be included in several different ways. Inbgu [9] and 3D-PSSM [18] use predicted secondary structures, 3D-PSSM and fugue [34] use structural alignments and genTHREADER uses a threading potential. In addition, at least two methods that only use sequence information, FFAS [32] and Sam-T99 [17], seem to perform better than PSI-BLAST. It was also noted that no method today can reliably distinguish between weak correct hits and wrong hits [4].
In the LiveBench studies it was observed that a correct prediction often is obtained from one method [4]. Further, some studies have also focused on the quality of the generated alignment [7,4,33,8]. An important conclusion from these studies that for different targets, the best predictions are often made by different methods. It is quite common for a single method and pairs of distantly related proteins that the optimum choice of alignment parameters differs from case to case. Thus, when evaluating the accuracy of a structure prediction protocol on a large set, it is quite clear that its performance could be increase if different, best suited approaches could be applied in appropriate cases.
The exact choice of parameters such as gap-penalties is of great importance for the performance of a method. Therefore, the development of better prediction methods is an art that only a few groups master.
How can these observations be used for making automatic fold recognition prediction as good as predictions of experts ? To answer these questions we need to try to understand what knowledge experts use and is not used by the servers (developed by them and others). We believe that there are three important contributions by the experts. These are biological knowledge, structural verifications and consensus analysis. Our recent studies indicates that of these three factors the last one is of most importance and that incorporating it into an automated method provides a significant improvement.
If a protein is known to be a DNA-binding protein, any high scoring hit to a DNA-binding domain would get the attention of an expert. Due to the current limitations in computer-readable classifications of protein functions this knowledge is hard to automatize. However, some attempts have been done. The SAWTED algorithm [22] searches for related keywords in SWISS-PROT [3] between two proteins. SAWTED is utilized by 3D-PSSM and was shown to increase its performance by a few percentages (MacCallum, personal communication). It is difficult to judge how much biological knowledge actually improves fold recognition, but certainly in some cases it can be important.
As well as biological knowledge can be, manual experts can also use structural knowledge. For instance it is known that secondary structure prediction algorithms are better at predicting secondary structures than fold recognition methods. Therefore, if a model clearly have four helixes a hit to an immunoglobulin can easily be disregarded.
Structural information can be used either directly in the alignment algorithm, as in Inbgu, or as a post-processing filter, as in genTHREADER [15]. The difference is that when used in the alignment algorithm a different alignment is obtained, but when using as a post-processing method only the score of a particular alignment is influenced by the structural information. Two different types of information have successfully been used in fold recognition methods, predicted secondary structures and residue contact information.
Intuitively it seems as if a post-processing filter might be most useful to deselect false positives. This also seems to be correct as genTHREADER, the only method that use a post-processing filter, has a very good specificity [5]. The inclusion of structural information in the alignment procedure might instead improve the alignment of distantly related proteins.
A common trick used by fold recognition experts is to use what could be referred to as a consensus analysis. Here, not only one prediction for each target is considered. Instead models from different predictions, with similar scores, using different parameters, from different methods or for homologous sequences, are taken into account. In contrary an automatic fold recognition method returns a list of hits and when the performance is measured only the single highest scoring hit is used. Until the introduction of Pcons we are not aware of any method that utilize this type of information.
What is an expert actually doing when he examines several hits and why could it be used to increase the performance ? One obvious feature is that using several parameters increases the possibility to create at least one good model. A method can create several predictions for each target-template pair and then use the one with the highest (normalized) score. Some groups have already used a simple form of consensus predictors, where several models are created for each sequence-template pair. The Inbgu method performs five alignments using combinations of single sequence and profile data [9]. The 3D-PSSM method performs 3 alignments for each sequence-template pair [18]. In both Inbgu and 3D-PSSM all alignments are made using predicted secondary structure information for the query sequence and the experimentally determined secondary structure of the template protein. The alignments of Inbgu are made using either single sequence or multiple sequence information of the query and the template. In 3D-PSSM two alignments are made using the query sequence and two different template profiles, one being derived from a superfamily-wide structural alignment, the third alignment uses the template sequence and a profile obtained from the query sequence. For each query-template pair these methods choose one alignment, 3D-PSSM chooses the highest scoring one, while Inbgu takes also the rank into account. However, these method still only consider the different templates individually, while manual experts often examine multiple hits. Therefore, if hits 2 to 9 all are Tim-barrels but the first hit is something else the manual expert would guess on a Tim-barrel structure while an automatic method would not.
Here, we describe the process leading to the development of a consensus method that tries to mimic the work of an expert, Pcons. We show recent results from the LiveBench process that benchmarks the performance of Pcons and other fold recognition methods [4,5]. Finally we will describe some current attempts to increase the performance of Pcons.
During the CASP4 process it was realized that the meta-server, described in another chapter, gave all participants in CASP4 the possibility to easily use a large set of fold recognition methods easily. Several of the top-performing groups in CASP4 utilized the results from the meta-server. However, they also used manual knowledge and other methods. In contrast, together with Daniel Fisher and Leszek Rychlewski, we wanted to examine if an automatic consensus prediction would perform better than the single servers and possible as good as the manual predictors.
During CAFASP we were not able to create a fully automated consensus server, therefore we used a semi-automatic procedure to perform the consensus predictions. These were submitted to CASP as the CAFASP-CONSENSUS semi-automatic predictions. Since the end of CAFASP we have developed the fully automatic consensus predictor Pcons. The process of both the automatic and manual consensus predictions can be described in three steps:
In CASP4 we detected three scenarios: The first scenario consists of trivial predictions, where most methods predict the same fold with significant scores. In this cases we picked one of these predictions more or less randomly. The second scenario was when no servers gave any significant hits, but that a particular SCOP fold was clearly most frequent among the top hits. In this case we selected one prediction from this fold. In the last scenario there were no fold selected significantly more frequently than others. Here, we tried to use additional information. It was noted that in the first two scenarios almost always the most frequent fold was almost always the correct one.
According to the official ranking the CAFASP-CONSENSUS predictor performed better than all other automatic methods, and only six manual groups managed to perform better, although all of the consensus data and our predictions were publicly available. Post-predicting the CASP4 targets showed that the automatic Pcons predictor performed equally well as the best individual methods, but not significantly better.
The Pcons approach presented here differs significantly from earlier consensus predictors. It follows the approach described above for the semi automatic CAFASP-CONSENSUS predictor used in CASP4. Pcons follows the following steps, see figure 1 and 2.
![\rotatebox{0}{\includegraphics[width=90mm]{nn-description-new}
}](img3.png)
|
Following the protocol sketched above there are several possible choices that an automated consensus predictor can be implemented. In the following sections we will discuss how some of these choices affects the performance of Pcons.
The current version of Pcons utilizes 7 servers (pdbblast, FFAS, Inbgu, mGenTHREADER, SAM-T99, 3D-PSSM and fugue). The top 10 hits from each server were converted into models by the meta-server. To create the optimal consensus predictor it is necessary to use the optimal number of models from the best servers. We have used the servers that performed best in LiveBench [5] and some limited experimentation. The conversion uses the simplest possible method, i.e. using the backbone coordinates from the template. The resulting model might include gaps and if there are insertions there will be some residues missing. In a future we plan to replace this process by using a homology modelling method to build a full model of the query protein for each predicted model. This will allow the use of additional terms that can be used as an input to the network.
The main idea about the consensus predictor is to use the observation that the correct fold often does not occur alone among the top hits. For instance if many of the top hits are immunoglobulins it is quite likely that the query protein actually is an immunoglobulin. But, what is the best method to examine how many immunoglobulins are found among the top hits ? One possible method could be to use one of the databases over protein folds, such as FSSP, SCOP or CATH. However, this involves several problems. These databases all use different domain definitions, while the different servers could use any of these or another set of domain definitions. Another problem is that these protein fold databases are updated less frequently than some of the servers. To avoid these problems we use structural comparisons of the models in Pcons.
Structural comparisons can be done in two different ways. Either the structure of the template or the structure of the models can be used. Structural comparisons of the models can be done either by taking the alignment into account (alignment dependent) or ignoring this (alignment independent), while the template comparison needs to use alignment independent structural superpositions. In our first studies we used both template and model comparisons [21] in an alignment independent way. However, the structural alignment method is too time-consuming for a server version. Therefore, all versions of Pcons discussed in this study only utilizes alignment dependent model comparisons. In our experience the difference in performance between the different structural superposition methods is not very significant.
Besides the decision to use alignment dependent structural superpositions it is also possible to choose a measure for the similarity between two models. One simple measure of similarity could be rmsd. However it is possible that the models are only partly correct and then other measures are better. We choose to use the same type of measures as used for the evaluation of the model quality, see below.
Pcons predicts the quality and accuracy of all collected models, and if several servers predict one particular fold, Pcons will assign a high score to it. Pcons also differs from most earlier methods in the way how correct predictions are defined. Pcons is trained to predict the quality of a model while most other methods are optimized to detect if a correct fold is recognized. This might be advantageous as it is not trivial to uniquely define folds [14], and even if the correct fold is found, the alignment could potentially be wrong. The problems with domain definitions and updating of fold recognition methods, described above, makes it very difficult to train Pcons to predict the correct fold. Therefore Pcons is trained to predict the quality of the model.
Several different measures have been developed to measure the quality of a protein model. These can be divided into four groups. Global, such as rmsd, that uses the whole model to measure the quality. Alignment dependent, that uses the most similar segment between the model and the correct structure. Alignment independent measures are identical to alignment dependent measures but allow a shift in the alignment. Finally there are template based measures. We have recently reviewed these measures and concluded that ``alignment dependent'' measures where best at identifying the best models, while ``alignment independent measures'' are better at detecting fold recognition [6].
In the first Pcons version we used the alignment independent measure LGscore2 to evaluate model accuracy [6]. In the more current version of Pcons we have used an updated version of the alignment dependent LGscore. The updated version provides better statistics for short segments. Since the first Pcons was released we have used several different measures of the quality, including MaxSub [35], new versions of LGscore and touch [5]. Here we observed that using the LGscore we obtained the best correlation between the predicted and the real quality measures. However, the difference was quite small. It was also observed that if Pcons was trained to predict a particular measure it performed slightly better using that measure for the evaluation. Surprisingly, it was of greater importance which the scoring method used for the structural comparisons than the scoring used as the goal for the predictions. The best predictions of MaxSub quality were obtained if MaxSub was used as the measure of structural similarity, etc.
As we have claimed above Pcons performs better than any single automatic method and the performance might even rival manual experts. Here, we will describe some different tests done to analyze the performance of different fold recognition servers. These are based on the LiveBench benchmarking system [4,5]. For simplicity we have mainly used MaxSub as the evaluation method, but the results are similar using any other evaluation method.
LiveBench-2 is based on a large set of 203 proteins. Each week all new structures in PDB that does not show any significant sequence similarity to an already known protein are collected. A meta-server submits a sequence to all participating servers, collects the predictions and analysis the results automatically. Pcons-I was trained on data from LiveBench-1 and was thus included in LiveBench-2. Results have been divided into easy and hard target, depending on the best score obtained by pdbblast. The LiveBench process is continuously proceeding and can be found at http://bioinfo.pl/livebench/.
There are several possible methods to analyse the results from LiveBench. In the complete analysis several methods have been used and only results that are consistent throughout all methods are considered significant. For simplicity, here we choose to analyse the results using MaxSub [35]. In table I it can be seen that Pcons-I does not detect significantly more correct hits for the easy targets, while for the hard targets the number of correct hits is increased by about 10% from 50 (for 3D-PSSM) to 56. This indicates a small but significant improvement for the hard targets.
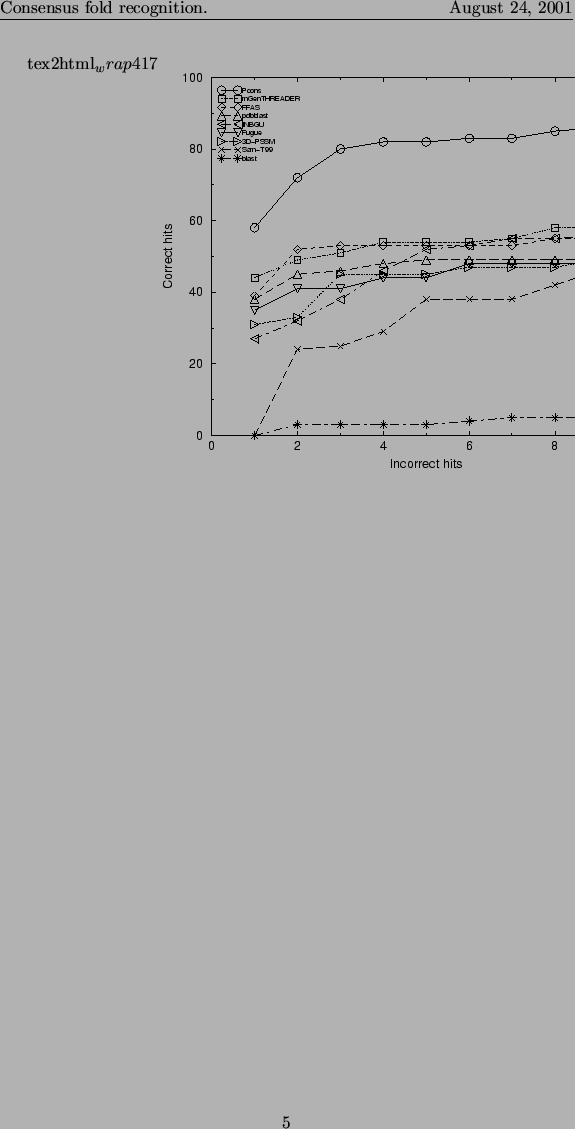
Another important feature of an automatic fold recognition method is to be able to distinguish between correct and incorrect hits. In figure 3 we plot the number of correct predictions at a given number of incorrect predictions. It can be seen that the consensus predictor identifies significantly more correct hits than any single server does. None of the individual servers detect more than the ``easy'' targets before a number of false predictions are detected, while Pcons detects more than 20 of the ``hard'' targets before any significant number of false positive predictions.
![\rotatebox{-90}{\includegraphics[width=90mm]{lb2-specsens}}](img5.png)
|
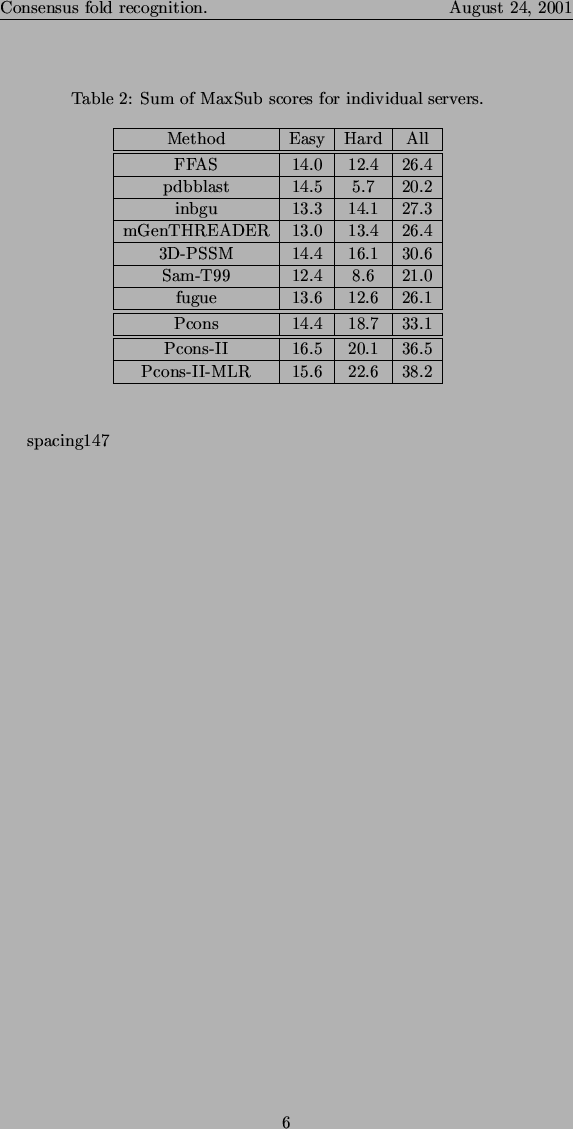
It is not only important to predict the correct fold, it is also important to produce a high quality model for a query sequence. One method to measure the quality of the models is to use the sum of the MaxSub scores for the best model according to each server. In table II it can be seen that for the hard targets Pcons produce better models than any single server (18.7 vs. 16.1 for 3D-PSSM), while there is not a significant improvement for the easy targets (14.4 vs. 14.4 for 3D-PSSM).
It is not obvious that Pcons should perform better than the best single protein structure predictor, however it does. In the introduction of this chapter we claimed that the main improvement was due to the ``consensus analysis'' used in Pcons but not used by the other servers. However, it is also possible that the improvement is obtained from some other type of information.
During the development of Pcons we developed several versions of Pcons. These include: NN-score, that only used the scores from the severs as its input, NN-noscore, that only used the ``consensus analysis'' as its input and, NN-model which was the final version of Pcons using both scores and network [21]. In table III we can see that for the easy targets the three different Pcons implementations perform equally well while for the hard targets the performance of NN-score performs worse than the other two. NN-score is the only Pcons predictor that does not use the ``consensus analysis''. In fact NN-score does not perform significantly better than the best single method. This indicates that the consensus analysis is the most important contribution to the improvements obtained by Pcons. Once this type of information is included into the individual servers it is very likely that a consensus predictor does not perform significantly better than the individual servers do. Interestingly, even completely ignoring the scores from the different methods, NN-noscore performs quite well. In the development of an MLR-based Pcons we also observed that the weights for the scores were very small, indicating again that the consensus analysis is the most important part of Pcons.
An additional piece of evidence for how the improvements in Pcons are
gained can be obtained by studying the response of the Pcons
networks. In figure ![]() it can be seen that even for
very low scores the predicted quality is quite high if there are
enough other models that are similar. It can also be noted that only a
few servers, such as GenTHREADER, can produce significant scores for a
hit that have not structural neighbors.
it can be seen that even for
very low scores the predicted quality is quite high if there are
enough other models that are similar. It can also be noted that only a
few servers, such as GenTHREADER, can produce significant scores for a
hit that have not structural neighbors.
![\rotatebox{-90}{\includegraphics[width=90mm]{respons2}}](img8.png)
|
The first version of Pcons was developed using data from LiveBench-2 and benchmarked in the LiveBench-2 process. In LiveBench-2 it was concluded that several servers had increased their performance and that some new servers performed very well. Therefore, we decided to create a new version of Pcons using the data from LiveBench-2.
The first generation of the Pcons server used predictions from six different servers. After some minor benchmarking we decided to use a set of seven servers for Pcons-2. One completely new server was included (fugue [34], while two new servers were updated (GenTHREDER to mGenTHREADER and Sam-T98 to Sam-T99.). In tables I and II these results are present as Pcons-II. It can be seen that a small, but significant, improvement is obtained using these additional servers. About 5% more correct structures are identified. The improvement is noticeable both for easy and hard targets.
The time for running Pcons increases with the square of the number of models. This makes it roughly twice as time-consuming to use seven servers (490 comparisons) instead of five (250 comparisons). This made the response time from Pcons to be in too long to be acceptable. We have made a significant speed-up of the structural comparison algorithm used to calculate the LGscore. This was obtained by ending the structural comparison if a fragment had an rmsd larger than (N+225)/45, where N is the number of residues in a the fragment. For more details look at http://www.sbc.su.se/ arne/lgscore/.
During the evaluation of CASP4 we noted that the LGscore did not give significant scores to short proteins. To deal with this problem we have re-calculated the measure of statistical significance, which the base for the LGscore measures. The original statistical measure was obtained from a study by Levitt and Gerstein [19]. However, the statistics was only calculated for proteins larger than 120 residues, while the fragments used by LGscore often are much shorter. Using these new measures gave no significant improvements but as the statistics is better we decided to use it anyhow. As mentioned above we have also tried to use other measures of the model quality.
Although neural-networks are a powerful tool to detect patterns, they are not always ideal. One such problem is that they might easily be over-trained and thereby not perform ideally for unseen data. To avoid these potential problems we examined the possibility to use Multiple Linear Regressions instead of the neural networks. The results are shown in tables I and II as Pcons-II-MLR. It can be seen that about 15% more correct hard targets are found using Pcons-II-MLR than the standard Pcons-II method. When studying the terms obtained from the MLR it was shown that the terms for the different scores were small in comparison with the terms for the ``consensus analysis''. The model-quality for the hard targets has also been improved. In LiveBench-3 the Pcons-II-MLR method will be used.
In this article we show that using a ``consensus analysis'' fold recognition methods can be improved significantly. Using this type of analysis we think that automatic fold recognition methods can challenge the performance of manual experts.
This document was generated using the LaTeX2HTML translator Version 2K.1beta (1.47)
Copyright © 1993, 1994, 1995, 1996,
Nikos Drakos,
Computer Based Learning Unit, University of Leeds.
Copyright © 1997, 1998, 1999,
Ross Moore,
Mathematics Department, Macquarie University, Sydney.
The command line arguments were:
latex2html -split 0 pcons2
The translation was initiated by Arne Elofsson on 2001-10-18
 and
and  . For Sam-T98 and pdbblast
even very high scores result in quite low outputs, when no
structural similarity exist.
. For Sam-T98 and pdbblast
even very high scores result in quite low outputs, when no
structural similarity exist.